|
在復雜的光學系統中,定義和測量最佳焦點和光軸是非常困難的。只有在整個視場內進行離軸測試才能確定可以得到最佳像質的配置。例如,由于傾斜造成的彗差通過調整補償通常是可以接受的。但是這種方法對離軸的像面質量卻沒有改善。
Among the most difficult things to define and measure for complex optical systems are best focus and optical axis. Only with the help of off-axis measurements over the full field is it possible to define the configuration that gives best images over the whole field. For example, it is generally accepted that coma due to tilt can be compensated by decentering the element, but this approach does not always produce desirable results for off-axis images.5
我們采用Spot Optics的波前測試系統對一個復雜f/4的數碼相機鏡頭進行測試,該鏡頭在平行光束、廣角位置有20多個光學面。并與理論測算的結果進行對比如圖2 。雖然我們的軟件可以測得許多參數,這里僅僅對MTF和澤尼克系數進行對比說明。
We used our instrument to test a complex f/4 digital zoom camera lens with more than 20 optical surfaces in parallel light at wide-angle position, and compared the measurements with the theoretical predictions (see Fig. 2). Though many parameters are available from the software, we focus here only on two: MTF and the Zernike coefficients.
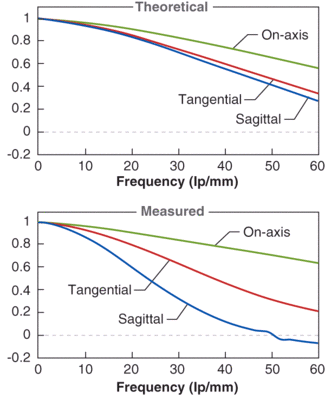
FIGURE 2. The theoretical MTF on-axis and at an off-axis angle of 28º, tangential and sagittal (top), is compared to the values measured with the Shack-Hartmann sensor (bottom). See table for the Zernike coefficients.
上圖為理論的近軸MTF和離軸28 º位置的切線方向和弧矢方向的MTF下圖為波前測量系統的實際測量結果。澤尼克系數可參看下表
Click here to enlarge image
在60 lp/mm 位置處的MTF值分別是近軸0.56, 切線方向0.34,弧矢方向0.27,相應的測量結果分別為0.64,0.21,和-0.073。這說明,相對于設計的模型,該鏡頭具有較大的離軸散焦和其它像差。然而,僅從MTF值無法推斷何種原因導致的,必須借助全面的澤尼克分析。
The theoretical MTF values for a frequency of 60 lp/mm are 0.56 on-axis, 0.34 tangential, and 0.27 sagittal. The corresponding measured values are 0.64, 0.21 and -0.073, respectively. This shows that the lens has a much larger off-axis defocus and other aberrations compared to that predicted by the model. However, from MTF measurements alone it is not possible to infer what is causing this drop: one needs the full Zernike analysis.
有趣的地方是,該鏡頭近軸中心位置的MTF高于該模型的設計值,說明在中心位置的光學質量超過設計的規格。這一點可以由所測到的較低的球差值印證(下面的內容會討論到)。
One interesting point to note is that in the center the measured on-axis MTF exceeds that predicted by the model, indicating that the quality in the center exceeds the specs. This is confirmed by the lower value of the measured spherical aberration, as discussed below.
上面的測試是在650nm波長進行的。通過更換濾光片并重新校正系統的方式,可以在任意波長進行測試。The measurements above refer to a wavelength of 650 nm. They can be made at any other wavelength by using a filter. Recalibrating the instrument is easy for any wavelength, because of the efficacy of the combine algorithm.
通過將測試得到的5個位置的標準澤尼克失常系數(3階彗差、球差、散光)與設計的理論值進行比較,計算得到與最佳焦面的散焦偏離量(um)。需要特別說明的是,我們的軟件是通過數學計算的方法得到散焦偏離量的,沒有任何物理掃描的過程,與MTF的測試方法完全不同。
We compared the standard Zernike aberration coefficients (third-order coma, spherical aberration, and astigmatism) measured at five positions with the theoretical values from the model (see table). We also calculated the defocus shift in microns, from flat image plane to best focus. It is worth noting that the defocus shift computed by our software mathematically accounts for all the aberrations; no physical scanning is involved, unlike MTF measurement systems.
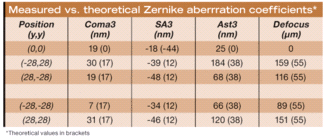
近軸設計的球差是-44nm,但是測到的值是-18nm,實際鏡頭性能超越設計值(如同MTF值體現的一樣)。當然,離軸的情況就不一樣了。這個測量得到的信息對分析加工生產過程的問題非常有用,例如可相應的修正非球面透鏡,或者加襯,修正元件之間的間距等等。
The design value of on-axis spherical aberration is -44 nm, while the measured value is -18 nm; thus, the actual lens performance exceeds the design value (as already noted for the MTF). However, at other off-axis angles, it is much more. This information can be useful for analyzing whether the problem is in production, such as incorrect shape of an aspherical lens, or in the mounting, such as incorrect spacing of the elements.
中心位置的彗差并非零值,說明各光學元件對準不理想,散光是對準和應力綜合作用的結果。此外,彗差和散光在光軸周圍呈非對稱性分布,對于該復雜鏡頭,這說明,除了離軸的像差是導因之外,個別透鏡單元未對準以及透鏡組都造成了該像差。
The nonzero value of coma in the center indicates the presence of misalignment of the optical elements, while that of astigmatism is due to a combination of misalignment and stress. Moreover, both coma and astigmatism are nonsymmetrically distributed with respect to the optical axis. For such a complex lens, this indicates that apart from the contribution of off-axis aberrations, misalignment of the individual lenses and groups of lenses are making a significant contribution to the aberration field.
本文討論的內容強調了在整個成像區域優化鏡頭的必要性,由于缺乏測試手段,直到目前還是不可能的。通過進行全區域分析得到的反饋信息對分析加工和裝配過程中的問題是一個功能強大和必須的工具。可以節省相當的時間和金錢。當然,我們這里討論的是一個數碼相機的鏡頭,該系統還可以用于手機攝像頭鏡頭,光刻鏡頭、遠心透鏡以及監控鏡頭測試,以及其它復雜光學系統,如HUD等。
This discussion underscores the need to optimize lens performance over the whole image field, which was not possible until now because of the lack of measuring instruments. Feedback from such a full-field analysis can be a powerful and indispensable tool for analyzing problems both in production and in mounting, leading to considerable savings in time and money. While we focused here on a digital camera lens, we have used such systems for testing mobile-phone camera lenses, telecentric lenses at 308 nm, and TV lenses.
REFERENCES
1. R.K. Bhatia, A. Ciani, P. Rafanelli, Proc. SPIE 1994, 68 (1993).
2. R.K. Bhatia, A. Ciani, Proc. SPIE 3134, 167 (1997) (also in: Selected SPIE Papers on CD-ROM Vol. 3 and Optical Testing, Ed.: Daniel Malacara-Hernandez, Vol. CDP03 (1999).
3. R.B. Shack and B.C. Platt, JOSA 61, 656 (1971).
4. R. Wilson, F. Franza, L. Noethe, J. of Modern Optics 34, 485 (1987).
5. R.K. Bhatia, Proc. SPIE 2479, 354 (1995).
|


 解決方案
解決方案